There are a lot of haves and have-nots in the software industry today. Some companies have more people throwing money at them than they know what to do with, and others are struggling to raise any money at all.
Logan Bartlett, Managing Director at Redpoint Ventures, shares their yearly “State of the Market” report to understand what is and isn’t happening in venture capital today. 2024 is the tale of two markets, so let’s get into some of the data.
NASDAQ is at an All-Time High

As of February of this year, NASDAQ was at 16,100. Now, it’s even higher at 17,700. If we’re unpacking the reason for that number, the market run-up hasn’t been evenly distributed. Some call it the Magnificent 7, consisting of Microsoft, Amazon, Apple, Facebook, Google, Tesla, and NVIDIA.
They’ve been driving the lion’s share of the S&P and NASDAQ growth. Those top 7 names represent the highest point in modern history as a composition of the overall S&P drivers.
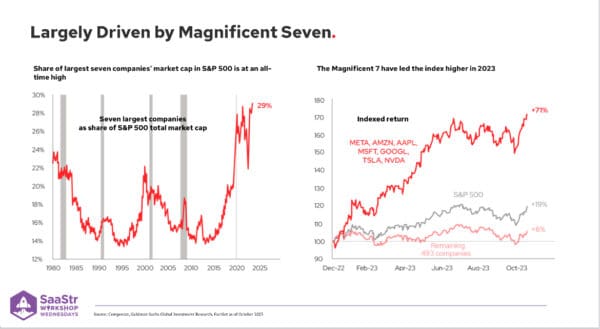
If you look, the indexed returns of those names were up 71% throughout 2023, and if you’ve followed NVIDIA, they’ve gone even higher. That 71% compares to only 19% for the rest of the market.
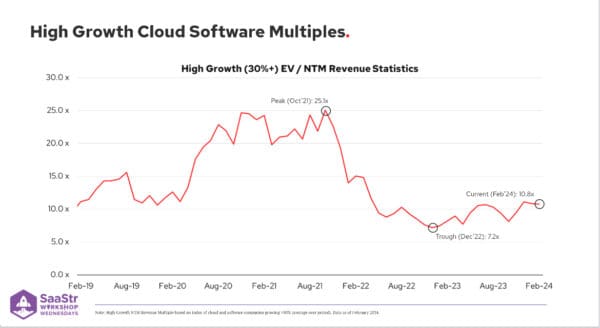
What does that mean for the B2B market? This chart is a basket of high growth defined by 30%+ in the markets. It wouldn’t be high-growth in private markets. You can see the NTM revenue multiples since 2019, and we’re now leveling out.
It was 10.8 in February 2024, and it’s roughly the same, or a little lower since then. Compare that to the high in the manic zero interest rate environment of 2021 at 25.1 times. For the most part, it has leveled out in the 8-10x forward revenue multiple range and is largely consistent with where things traded from 2008 to 2018.
The Market Has Stabilized
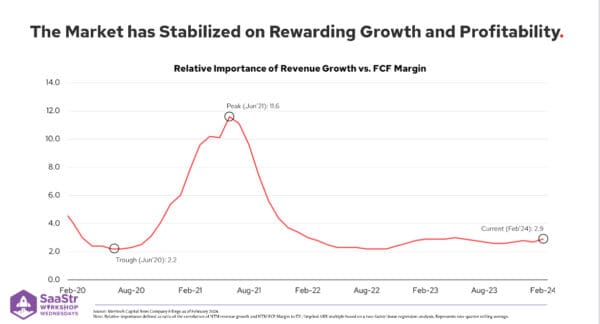
What does that mean for individual businesses? People look at the Rule of 40 and often R-squared, a correlation between growth and the valuation multiples. This chart shows a two-factor double linear regression, which essentially means how much a percentage point of growth impacts your valuation vs. a percentage point in profitability or free cash flow and the ratio between those two.
The lowest point where profitability was valued most highly compared to growth happened in June 2020, meaning a percentage in growth increase was worth 2.2x that of a percentage increase in free cash flow.
As we went through the zero interest environment, that was nearly 12x. Over the last couple of years, that has roughly leveled out between 2.5-3x. Growth is still worth more than profitability as you look at Rule of 40, but it’s much more leveled out with some consistency in public markets.
Leading Companies Shift How They Think About Revenue Growth and Free Cash Flow
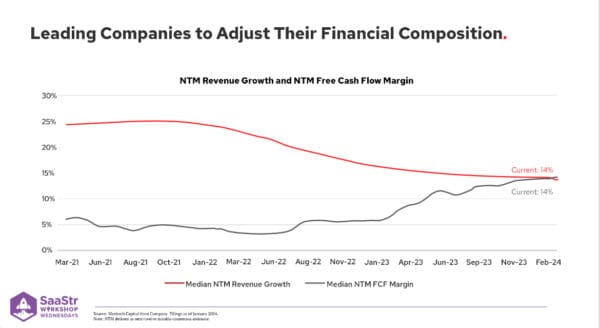
This has led to companies shifting how they think about the composition of revenue growth and free cash flow. Software businesses, for the most part, require heads to grow a business through sales reps or customer support. Not having those people in place also leads to profitability. You do have these levers you can control to balance the two.
Have We Bottomed Out?
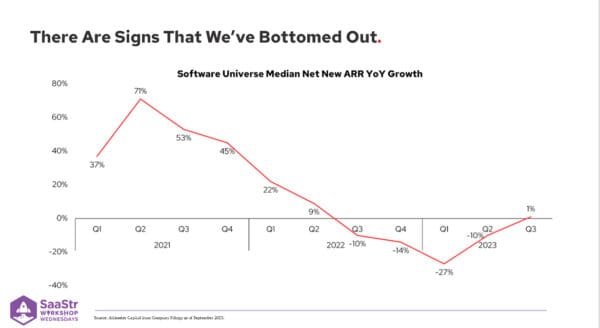
There are encouraging signs at a macro level. In the public markets, Q1 wasn’t pretty in terms of expectations, and businesses were sometimes missing their numbers. The most encouraging data was in Q3 and Q4 of 2022. For the first time, certain software companies were growing or had an increase in net new ARR compared to Q1 the year before.
It was a small sign that we might be bottoming out, and software selling might be getting incrementally easier than it was throughout 2022 or 2023.
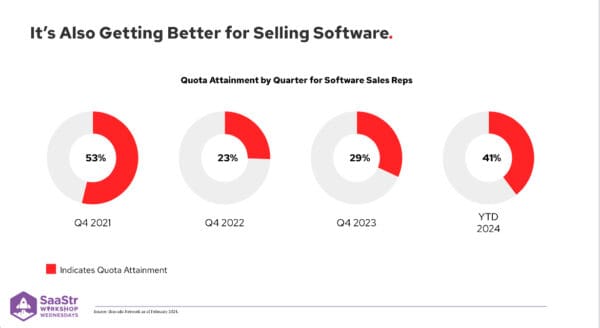
Some other data points to rep attainment. Bravado network is like LinkedIn for sales reps, where you can survey different sales professionals on their work. In the peak of the zero interest rate environment, 53% of reps reached their numbers. In Q4 of 2022, that number decreased to 23%, less than 1 in 4 reps making their numbers.
It picks up slightly in Q4 of 2023, and year to date, there has been an uptick to 41% or more of reps meeting their numbers. That number may be a function of lower quotas and resetting expectations, but the sentiment in private markets is more exciting and encouraging about the ability to sell software.
The Tale of Three Situations
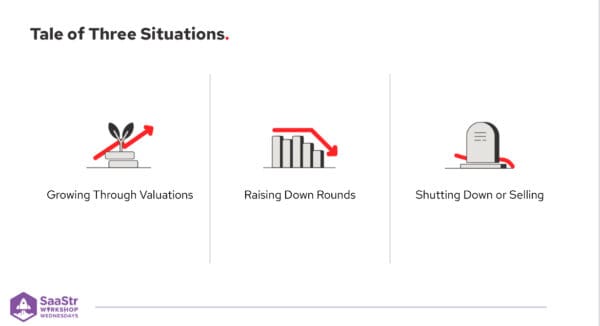
Three situations are happening in private companies.
- Some have held off on raising subsequent financing and hope to grow through their valuations.
- Companies are raising down rounds.
- Businesses are shutting down or selling well below the prior round’s valuation.
Situation One
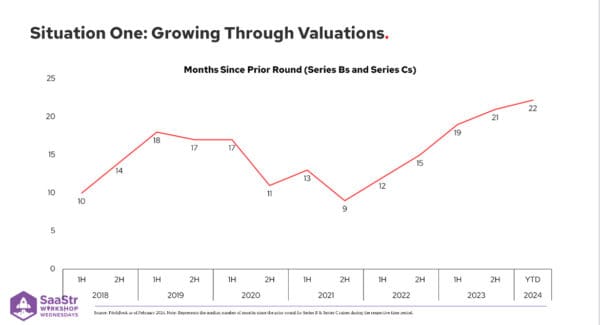
Many businesses are trying to grow through their valuations. This shows the time between the last round of funding for a basket of Series B and C companies.
Since the back half of 2021, this number has ticked higher and higher. During the second half of 2021, it was less than a year. If you raised in March, you’d raise again in December. Over the last couple of years, that number has trended higher as businesses try to grow through the prior round of valuations.
Now, they’re approaching two years between financings. That might level off or increase, but these companies are hoping that, even though multiples have compressed, they’ll be able to grow into a number that is higher than the prior round they raised.
Situation Two
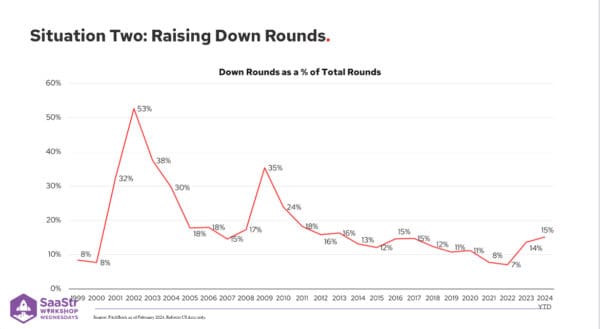
If you go back and look, we’re nowhere near the highs after the internet bubble in 2002, when 53% of all rounds done were down rounds. In 2009, that spiked to 35%. While the number of down rounds raised has gone up and doubled over 2023, it’s still very low on a historical basis.
Throughout 2024 and 2025, companies realize they cannot wait to get to an up round, so they’re going out and reckoning with a down round. While painful, it’s healthy for the overall ecosystem.
Situation Three
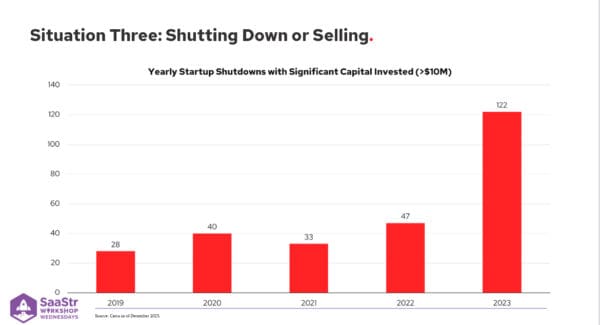
Unfortunately, many companies that raised over $10M in capital are shutting down or selling. The number of companies has trended higher each year since 2022 and 2023 and will likely continue to rise.
If History Repeats Itself…
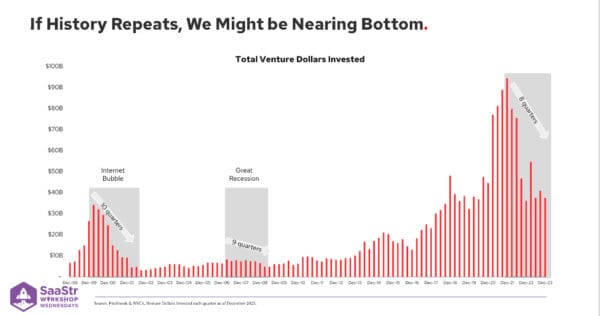
If history repeats itself, we might be nearing the bottom. During the internet bubble, it took roughly ten quarters or 2.5 years from the peak of funding to the trough before slowly building back up. After the financial crisis, it took nine quarters.
As of December 2023, we were two years into the peak, which was Q4 of 2021, so roughly eight quarters in, and it’s still trending slightly lower.
We should be nearing the bottom from a venture financing standpoint. Anecdotally, more dollars are going out in Q1 and Q2 of 2024 than over the course of 2023. VCs are picking up the pace, and we’re seeing a better supply of companies coming to market.
Many of those companies are the ones that burrowed down and didn’t want to reckon with valuation. They kept building to see what would happen and are now coming to market to raise a flat or slightly up round.
The Tourists Are Leaving
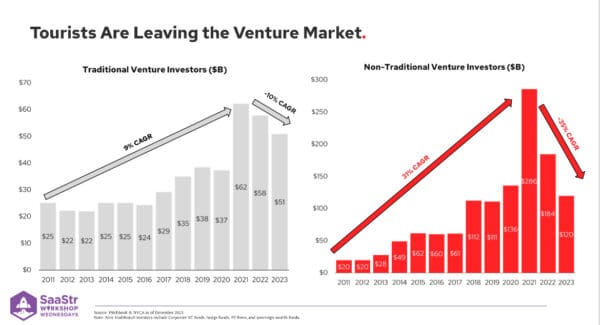
Over the last two years, we have seen a big outflow because tourists are leaving the venture market. The tourists, a.k.a. corporate VC funds, hedge funds, PE firms, and sovereign wealth funds, tend to come in hot during up markets and fade out when the market pulls back.
These non-traditional venture investors participate meaningfully. You can see that dollars invested by these non-traditional investors grew at 31% CAGR from 2011 to 2021, which is kind of astounding. They saw a 35% CAGR decrease from 2021 to 2023.
While more traditional firms have been more patient in scaling than non-traditional investors, dollars into the industry only increased at a 9% CAGR over those same ten years and an outflow at 10% CAGR since 2021.
The venture investors you work with tend to be more committed to the asset class through different cycles. Traditional investors invested $62B into the asset class even at the peak vs. non-traditional investors at $286B.
Spread Between Public and Private Markets Have Tightened
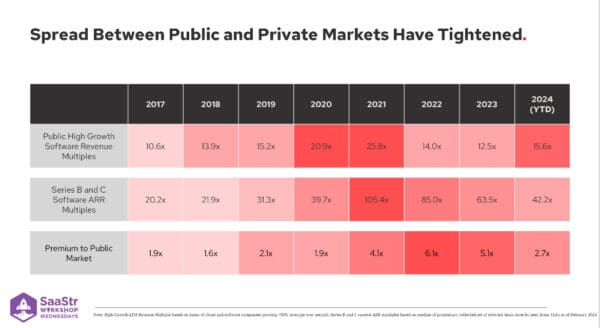
While Series B and C deals have picked up, and Series A deals have been muted over the last two years, multiples in totality haven’t picked up. This chart shows the spread between public and private markets.
Some version of this spread should always exist, particularly when comparing LTM revenue and current ARR, because private companies at smaller numbers should be growing significantly faster than public companies.
You should expect this number in private markets to be higher. Interestingly, the spread is tightening throughout 2024 and going down from its peak in 2022.
The markets went wild in 2020 and 2021, and while the spread was high in 2021, it was actually even higher in 2022. Intuitively, the reason is that public markets are priced every day, so adjustments can happen over a week or a month and see multiples fall off.
The private markets are very much a lagging indicator. So, while the public markets were trading at 8, 10, 12, and 14x revenue, private companies were getting done at 100-200x ARR.
AI Businesses are Demanding a Premium
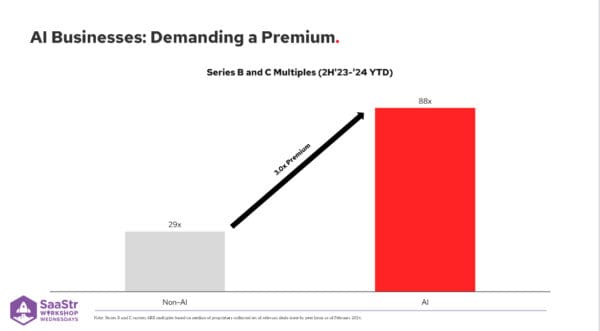
The haves and have-nots are really stark between AI and non-AI businesses. AI businesses are seeing a 3x premium. These businesses are growing much faster, with a median projected revenue growth of 400-500%.
It’s unknown how much of those numbers are exploratory budget vs. true recurring revenue and how sticky they are, but they’re growing at a much faster clip nominally, so it makes a good argument for the premium.
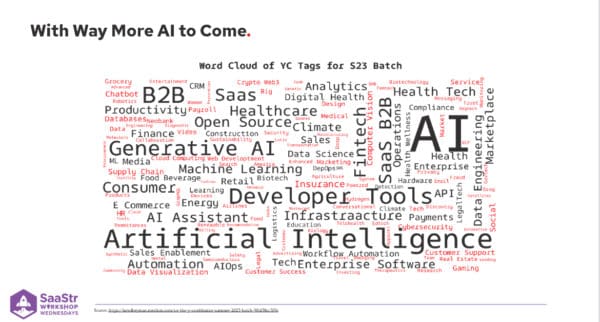
More AI is coming, with YC funding several AI-related businesses. You can see the word cloud of different terms from the 2023 YC batch, and we’ll likely see more over the years as these businesses mature.
Market Cycles Tend to Repeat Themselves
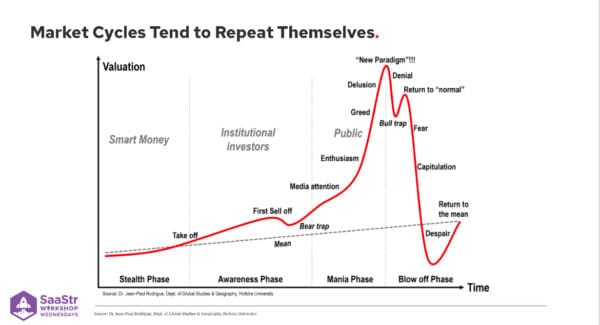
If you go back to the internet bubble, a number of companies created a significant amount of equity value during that period. That doesn’t mean they were all great returns along the way, but if you got into Amazon, Yahoo, eBay, or PayPal, you did quite well.
Just because a trend is inevitable doesn’t mean a company is. Sometimes, big value creators come after the euphoria that comes with these markets. Facebook and Google are great examples of businesses in the internet age that came after the real run-up in the market.